Gobe: interactive comparative genomics viewer
interactive, light-weight, customizable, web-based comparative genomics viewer with simple text input format.
| Authors: | Brent Pedersen (brentp), Haibao Tang (tanghaibao) |
|---|---|
| Email: | bpederse@gmail.com |
| License: | MIT |
Summary
You define a set of features, a set of tracks, and a css for styling features and you get a flash movie that allows you to interact with genomic data. The simple format makes it trivial to implement further interactivity including panning and zooming.
Interaction is customizable via javascript callbacks, css, and the input data. No server-side rendering is required. haxe programming language is used for development, but it is not required to use the library.
Annotations
The annotations to be rendered by the flash movie are in a simple text format. The best way to understand them is to briefly skim the summaries below and have a look at the examples in the data/ directory.
Annotation
An annotation is anything to be drawn. These will be things like CDSs, genes, mRNAs, UTRs or any feature you define and style. There are 2 special types: HSP‘s and Track Briefly, an HSP allows one to draw relationships between features. The relationship is inferred between consecutive annotations with type ‘HSP’ in the file. Track s allow one to explicitly set the limits for each track (otherwise inferred by the extent of the features in that track).
The annotation file is a text file with 7 comma-delimited columns per row:
- id: a unique identifier for this annotation. this is anything you want, can be your own database id or gene name or just an enumeration.
- track_id: the id of the track on which to draw this feature. See Track.
- start: the start of the feature.
- end: the end of the feature.
- type: a feature type (CDS, gene etc). If not specified, ‘default’ is used.
- strand: either ‘+’ or ‘-‘, the strand of the feature. HSP‘s with a +/- match should both be assigned - as the strand. If not specified ‘+’ is used.
- optional name: the name of the feature e.g. ‘At2g26540’. Can be anything. If not specified id is used.
- optional color: the color of the feature to override that specified by its type. if not specified the value in type is used.
an example looks like
1,5,25,38,HSP,+,name1
2,4,22,123,HSP,+,name2
At2g26540,4,1110,1683,gene,+,feature name
3,4,1210,1653,CDS,+,name3
4,4,1210,1653,CDS,-,name4
Note the last 4 will all be drawn in a Track with id 4. The 5th will be drawn in track with id ‘5’ and only the 3rd item is on the - strand. You may have thousands of annotations. The ids do not have to be numeric. Consecutive HSP‘s will be linked with an edge.
Glyphs
Glyphs can be specified in the .css file as
{ glyph: cross; fill_color: #fff000; fill_alpha: 1.0 }
when a row in the annotations file has a type of ‘cross’, it will then be drawn with a glyph that appears as a cross a the specified as the x coordinate specified. For glyphs, the xmin, xmax columns will likely be the same, if not, the glyph will be rendered in the center of the specified range.
Text
when the glyph is specified as glyph: text_glyph, the text in the name field will be rendered as is. The text can contain any markup that flash can understand. See here for a description of the supported tags. This allows arbitrary labelling, coloring, and sizing for each feature. See the example in glyph.txt
Track
An line in the annotation file with type ‘track’ defines the name and extent of regions a track. The first column is used as the track_id (which is referenced by other anntations) and the 2nd column is used as the display name. The start and end indicate the bounds of the track. Annotations outside of these bounds will not be rendered.
an example looks like (note this is the same format and same file as Annotations)
track_1,Track 1,9,1999,track
So in that example, the bounds are from 9 to 1999 in basepair coordinates and any annotation beloning to this track will use ‘track 1’ in the track column.
NOTE that if no tracks are specified then the track ids and extents will be inferred from the annotations. The extent of the annotations for each track will be padded slightly to calculate the extent of the track.
HSP
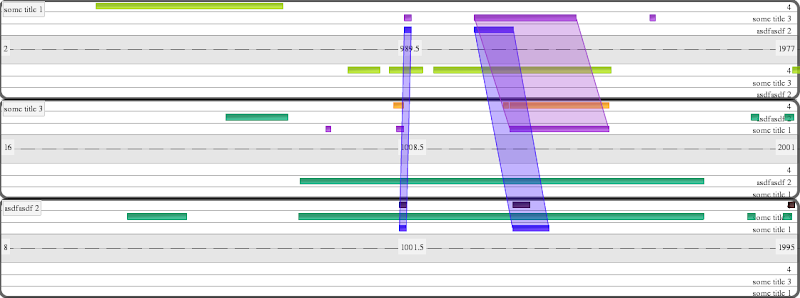
Consecutive HSP’s specified in the Annotations file are related. Inside the flash movie, clicking either part of an HSP will result in a wedge being drawn between it and its pair (as in the example images).
edges are inferred between consecutive HSP’s. So that hsp annotation lines like:
1,HSP,25,38,+,4,4
2,HSP,22,123,+,5,5
3,HSP,35,68,+,4,4
4,HSP,99,223,+,5,5
will infer edges between HSP’s 1,2 and HSP’s 3,4. This is common e.g. when parsing a blast, where it’s very simple to output consecutive lines for a single blast pair.
Any annotation beginning with “HSP” will be treated in this manner. This allows one to have different style classes for HSPs. e.g. HSP_blue, HSP_red.
Style
Styling is done via CSS. See the default style in gobe. When adding new features, it’s wise to add a new style corresponding to each feature type. The style sheet is specified on the URL through the style argument. e.g.
&style=/static/super-awesome.css
it must be on the same server as the SWF movie, or set up on a server that allows access via crossdomain.xml.
Plots
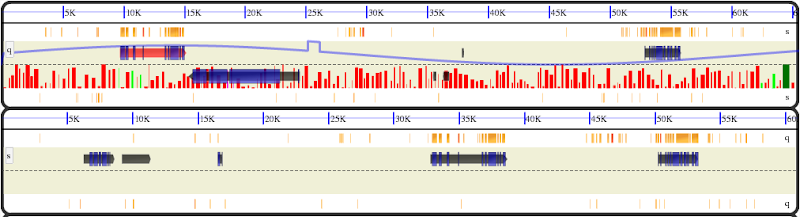
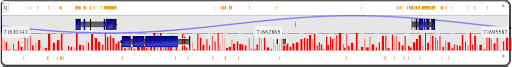
It is also possible to plot line plots and histogram plots. Here is an example with a line plot on the top strand and a histogram on the bottom strand. (this is linked in index.html examples).
LinePlots
The data-source for a line plot is indicated in the annotations file by a line like:
#id,track_id,xmin,xmax,style,strand,data-source
plot1,q,71630143,71695587,plot_line,+,data/pair/gc_content.txt
where the track_id indicates the track on which to draw the plot. and the final column indicates a (local) url from which to get the data. The data format is a single y value per line with the number of lines matching the range specified by the xmin, xmax parameters in the annotations file. NOTE: the style type specified in the annotations file must be exactly: ‘plot_line’. Data is scaled automatically. If a plot is specified in a new track (without other annotations, the values specified in the xmin, xmax will be used as the track bounds and it will be drawn in it’s own track.
The line-color and width are specified in the css file under plot_line. See the example data , annotations file (the line with id of ‘plot1’) and css
Histograms
Histograms are specified in the same manner as LinePlots except the style type must be: ‘plot_hist’. An example annotations line looks like:
#id,track_id,xmin,xmax,style,strand,data-source
plot2,q,71630143,71695587,plot_hist,-,data/pair/hist_data.txt
the format for histogram data is 4 columns:
- xmin
- xmax
- y
- hex-color
so example data looks like:
71692442,71692569,20,#ff0000
71692721,71692883,21.444,#fc0000
71693023,71693079,38,#ffff00
71693375,71693591,60.2,#ff00bb
This allows one to specify arbitrary widths and colors for each bar.
Javascript Callbacks
Whenever you click an annotation Gobe.onclick() is called with arguments: id, name, bpx, px, track_id corresponding to the values in the annotations file you specified. You should override this callback to perform sophisticated queries on an annotation, e.g.: via an AJAX call to a server-side script which will return more information about the feature.
Getting Started
The best way is to copy the index.html example included in the repository, adjust the paths to correctly point to your own gobe.js and the gobe.swf and then specify the paths to your own data with a url like:
/gobe/?annotations=data/t.annos&style=gobe.css
Once you have each of those files in the proper location, gobe will render the interactive flash movie.